

Claude Dashboards demo
One question in. A live executive dashboard out.
We prepared a BigQuery warehouse for a fictional retailer, asked Claude Dashboards one plain-English question, and checked every number it gave back.
Northbeam Outdoor Co. is a fictional company. The data is synthetic, built by us to behave like a real retailer's, mess included. Claude Dashboards is an Anthropic product in beta; we're an independent consultancy and not affiliated with Anthropic.
Step 1: The starting point
Real-world data is messy.
We started where most companies are: raw exports from a web shop, a point-of-sale system, a CRM, ad platforms, and a help desk, with all the problems that come with them.
- 83,765
- order rows in the raw export, for 81,960 real orders
- 1,303
- duplicate rows from a re-sync
- 502
- test orders left in production
- 52,728
- CRM records for 51,212 actual customers
Why it matters
Point any tool at raw data and it will answer confidently. And wrongly.
Summing the raw order table the obvious way overstates 2025 revenue by $594K, almost 8%. Duplicates, test orders, cancellations, and refunds all get counted as sales. AI doesn't fix that. It just gets you the wrong number faster.
2025 revenue from raw tables
$8.26M
Overstated by 7.8%
2025 revenue from the prepared layer
$7.66M
The number to run the business on
Step 2: The foundation
We built the layer Claude reads from.
A small analytics dataset in BigQuery that answers the questions an owner actually asks, with the business rules written down where an AI can find them.
Clean tables, one grain each
Orders, order lines, customers, products, stores, ad spend, and support tickets, each deduplicated and with test data removed.
Cost at the right point in time
Product cost comes from the supplier price that was in effect on the order date, so margin reflects what goods actually cost.
Every metric defined once
A metric_definitions table spells out net revenue, gross margin, refund rate, and CAC. Every table and column carries a plain-English description.
Step 3: The question
Then we asked one question, in plain English.
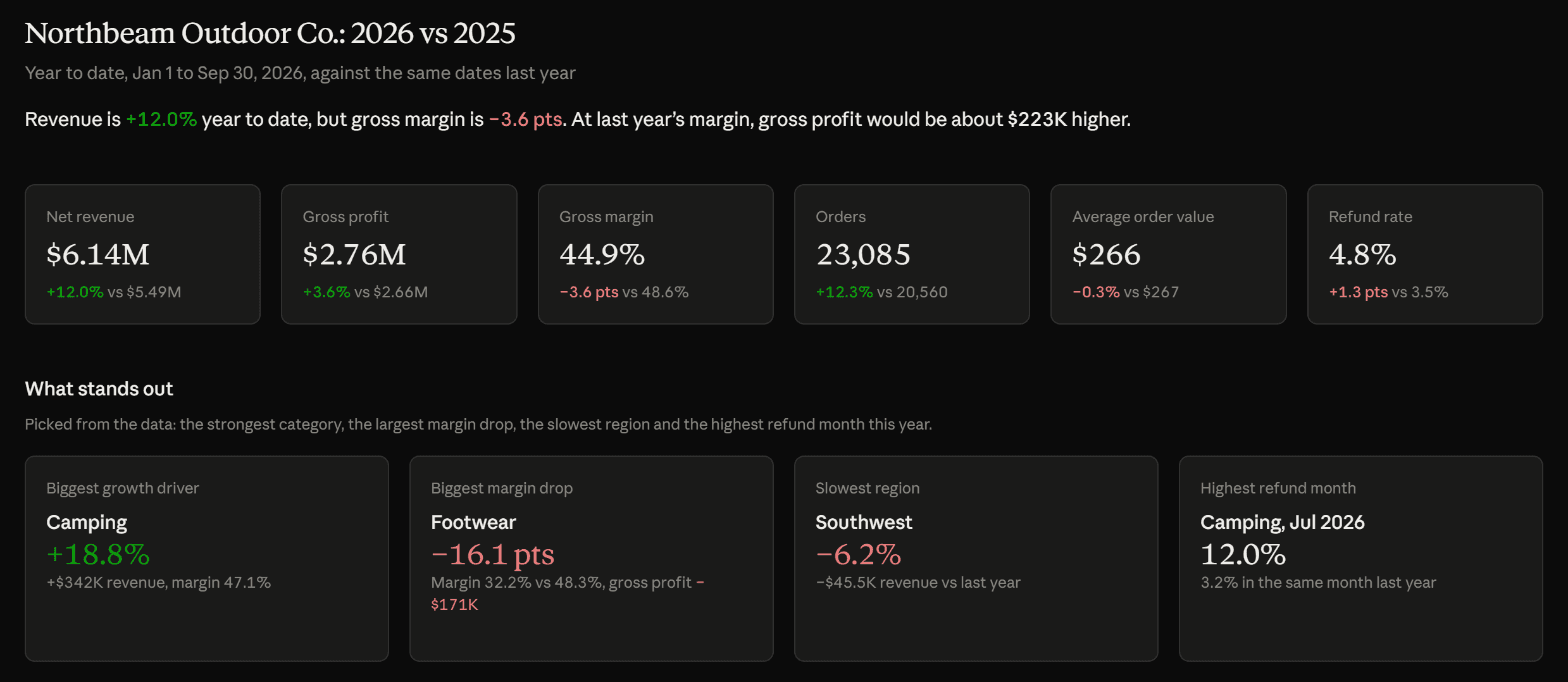
“I run Northbeam Outdoor Co. Our data is in BigQuery (project …, dataset northbeam_analytics) and runs through September 30, 2026. Build me an executive dashboard: how is 2026 going compared with 2025? Show revenue, margin, and where we're growing or slipping.”
The exact prompt, with our project ID removed. No SQL, no field names, no chart specs.
What it found
It went looking for the story, not just the totals.
Nobody told Claude to look at Footwear or the Southwest. It explored the data, picked out what mattered, and built the charts to show it.
Margin
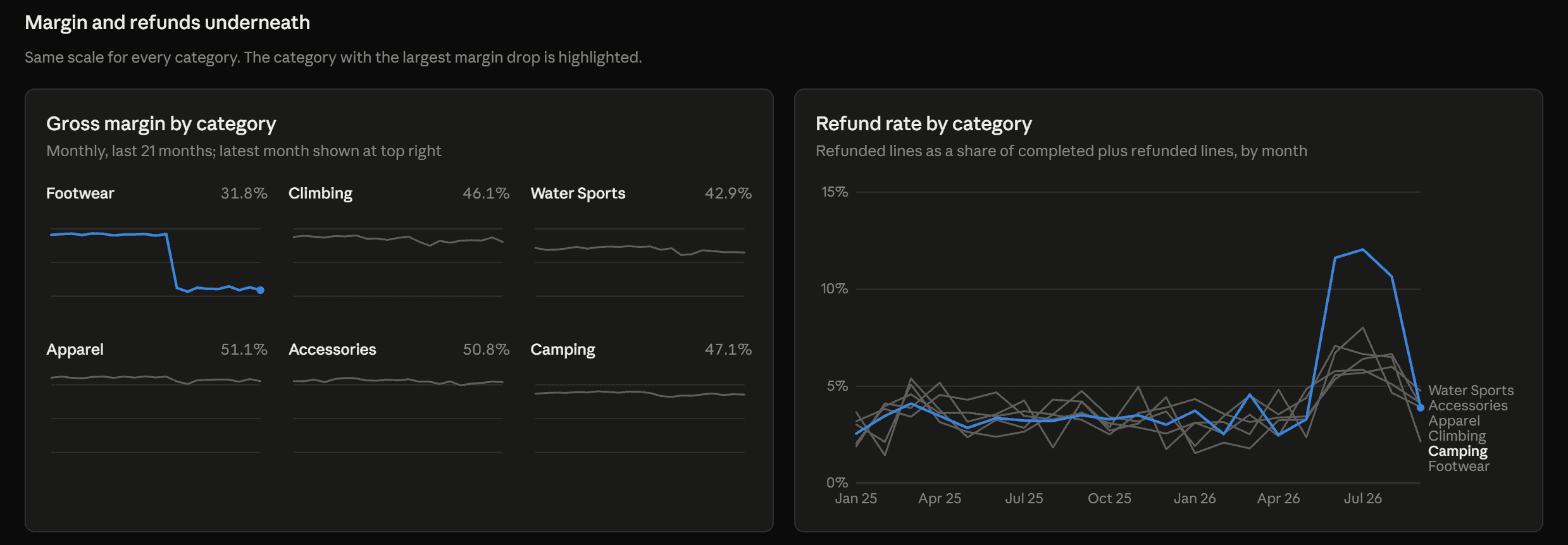
Footwear quietly lost 16 points of margin
Footwear revenue was flat, so it would never show up on a revenue report. Claude found that its gross margin fell from 48.3% to 32.2% starting in January 2026, a $171K hit to gross profit, and that unit cost was up while price per unit was down.
Growth
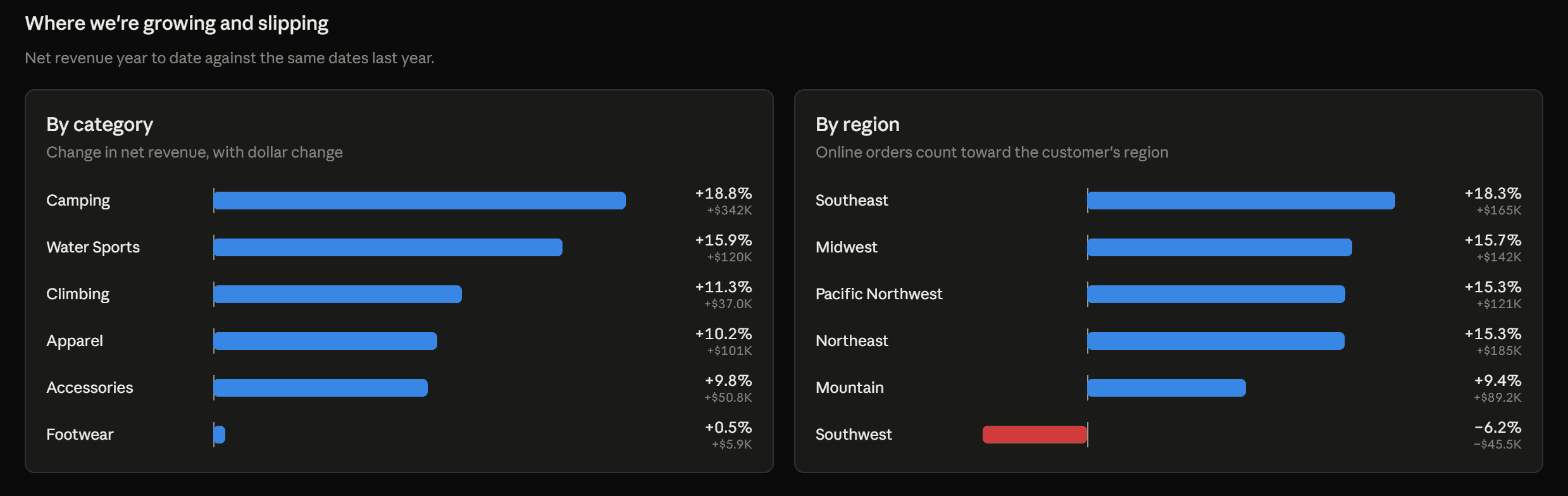
Strong growth everywhere except one region
Revenue was up 12% overall, led by Camping at +18.8%. The Southwest was the only region shrinking, down 6.2%, with both online and in-store sales lower.
Trend
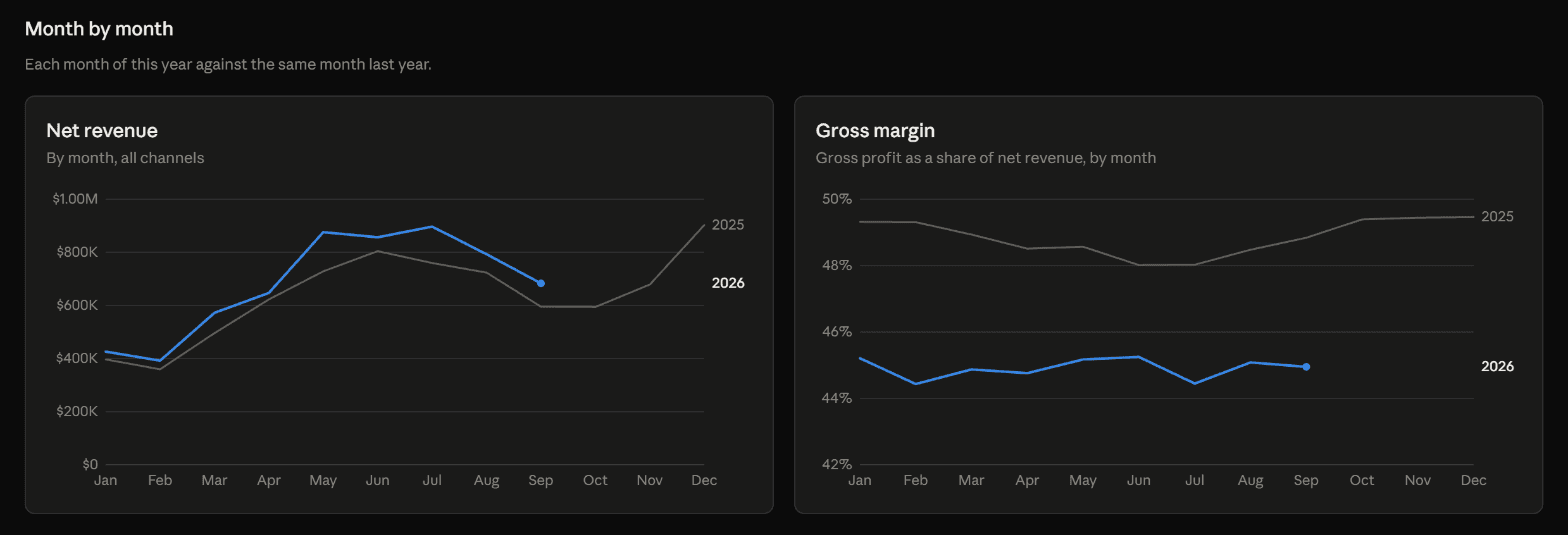
More revenue, less profit per dollar
Every month of 2026 outsold the same month of 2025, but margin ran about four points lower all year. At last year's margin, gross profit would have been about $223K higher.
A second question
Same warehouse, different person, different question.
The foundation isn't built for one report. Here's the marketing lead asking about ad spend, against the same BigQuery dataset.
“I lead marketing at Northbeam Outdoor Co. Our data is in BigQuery (project …, dataset northbeam_analytics) and runs through September 30, 2026. Build me a marketing dashboard: where is our ad spend working and where isn't it? Show spend, new customers and cost to acquire a customer by channel over time, and tell me what you'd change.”
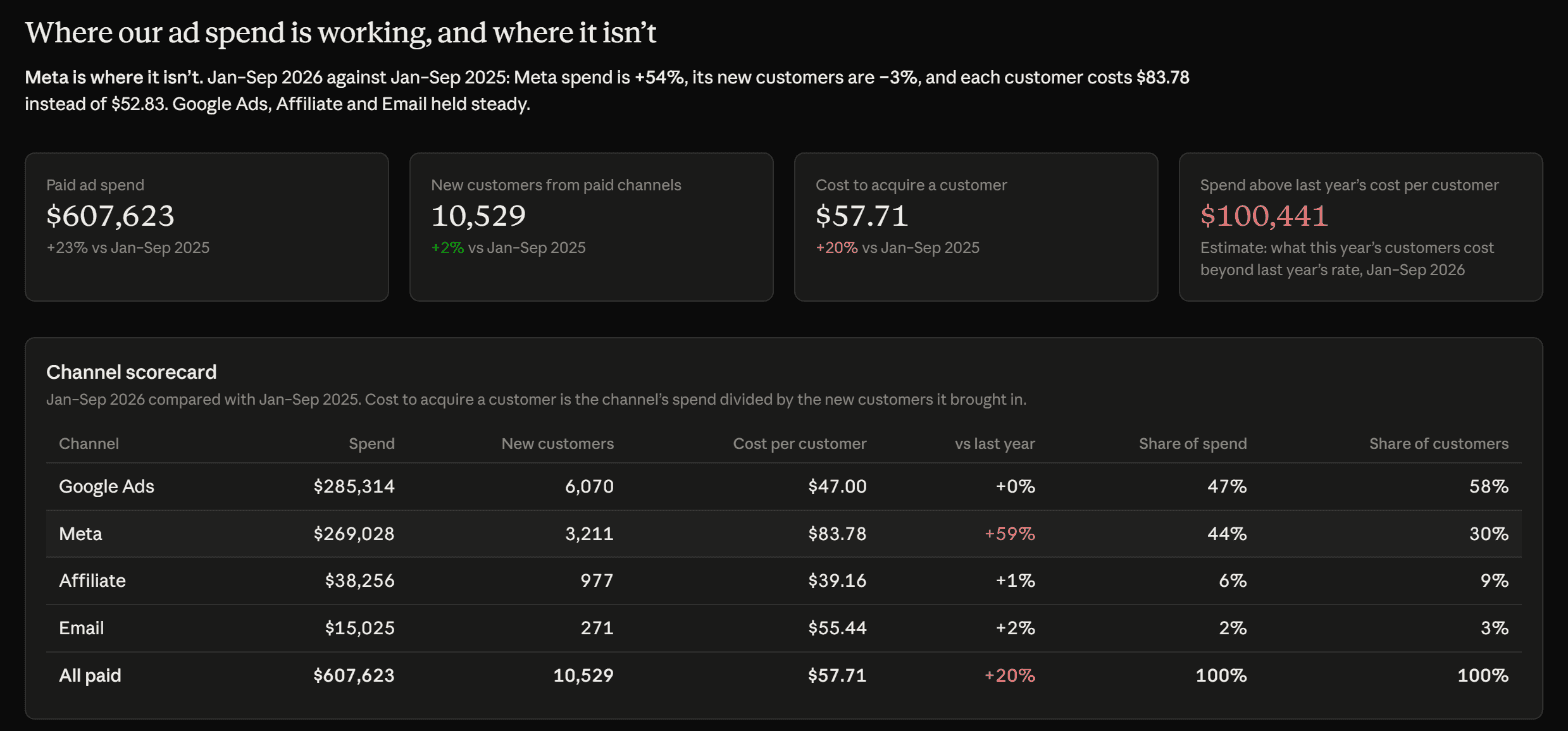
It found exactly when it broke, and why
Meta's cost per customer jumped in January 2026 and stayed there. Price per click didn't change; it now takes about 91 clicks to win a customer instead of 58. The problem is after the click.
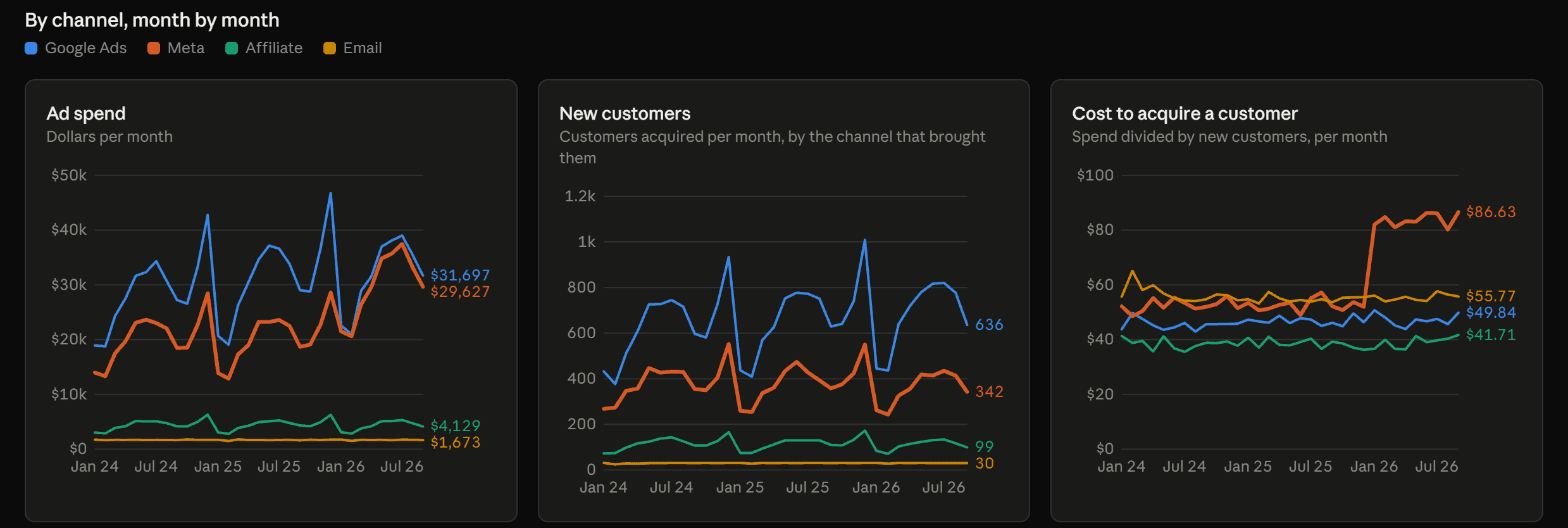
Then it said what to do about it
Pull Meta back toward last year's level, run a holdout test before writing it off, and move savings to Google Ads in steps. Specific, sized, and cautious where the data can't prove a cause.
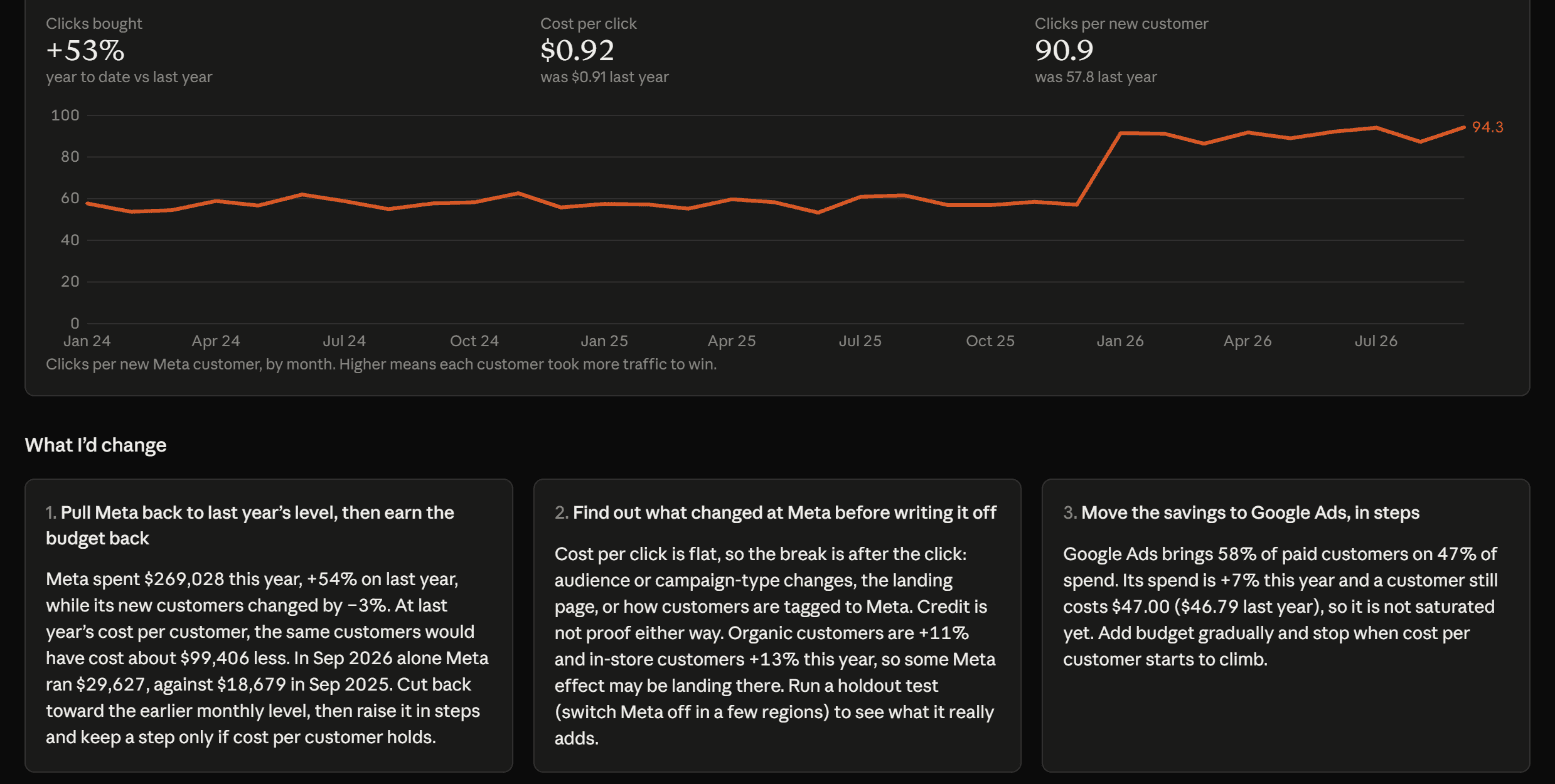
Step 4: Trust
Then we checked every number.
We worked out the right answers independently, from the data generator and our own queries. Here's how Claude's dashboards compared.
The one thing we caught
The first version named Camping as the biggest margin drop, and one chart came up empty. BigQuery had returned some numbers as text, so “−16.1” sorted after “−0.7”. We pointed it out in one sentence; Claude found the cause and fixed both. It's a good reminder of why a human review is part of every dashboard we deliver.
| Metric | Claude's dashboard | Our check | Match |
|---|---|---|---|
| Net revenue, Jan to Sep 2026 | $6.14M | $6,142,787 | |
| Net revenue, Jan to Sep 2025 | $5.49M | $5,486,293 | |
| Gross margin, 2026 vs 2025 | 44.9% vs 48.6% | 44.93% vs 48.56% | |
| Footwear gross margin, 2026 vs 2025 | 32.2% vs 48.3% | 32.2% vs 48.3% | |
| Southwest revenue change | −6.2% (−$45.5K) | −6.17% (−$45,528) | |
| Paid ad spend, Jan to Sep 2026 | $607,623 | $607,623.36 | |
| Meta cost per new customer, 2026 vs 2025 | $83.78 vs $52.83 | $83.78 vs $52.83 |
Claude also said, unprompted, that it followed our metric_definitions table for revenue, margin, and refund rate.
No black box
Click any number to see where it came from.
Every figure on the page links back to the SQL that produced it, the table it read, and the raw result. Anyone can audit it, and anyone with edit rights can change the query.
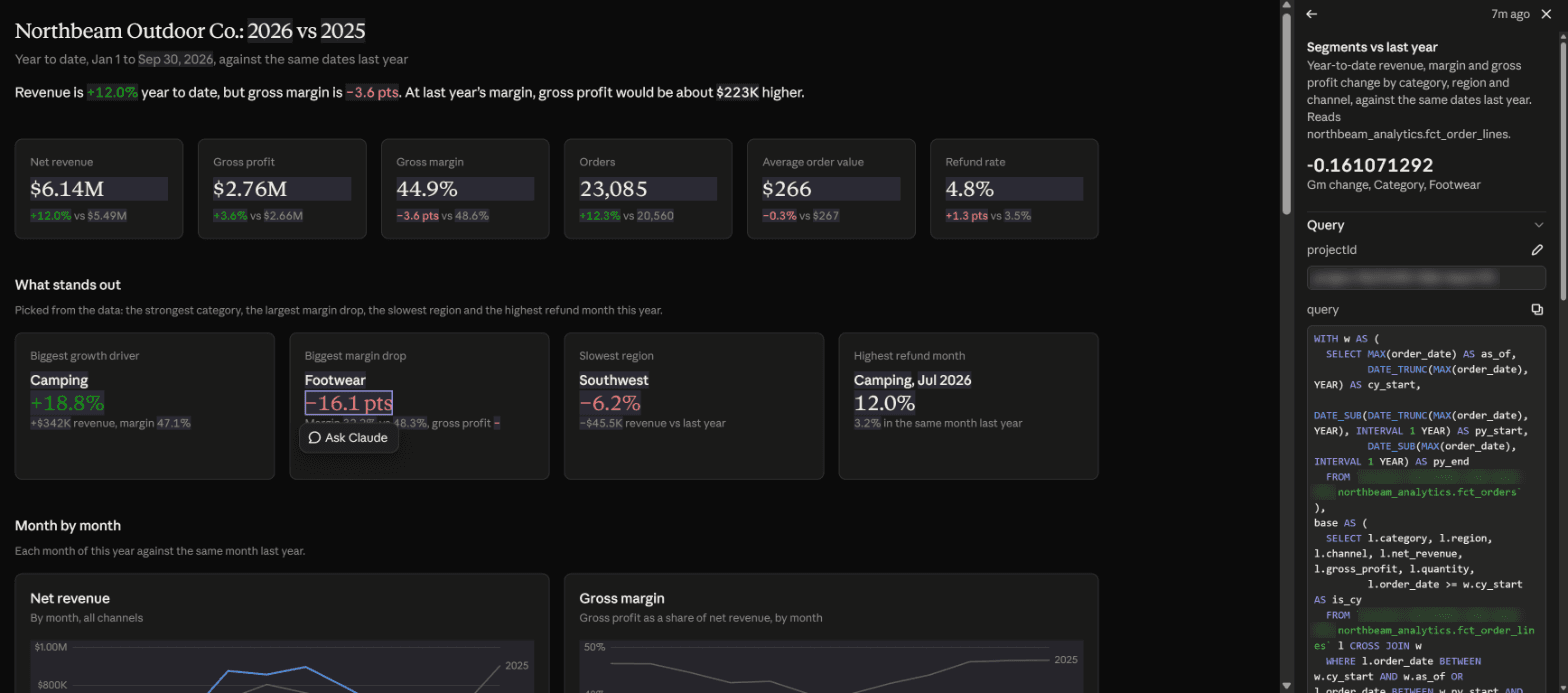
For your business
The dashboard was the easy part.
Claude Dashboards is impressive when the groundwork is done. That groundwork is what we do.
A warehouse worth asking
Claude reads your tables as they are. We build the clean, documented layer underneath so the answers come out right.
Definitions everyone agrees on
We settle what revenue, margin, and churn mean for your business, and write it where Claude will find it.
Access set up properly
Shared dashboards run with each viewer's own warehouse permissions, so people only see data they're allowed to see.
A human review
We check the numbers before anyone makes a decision on them, then teach your team to do the same.
Good to know: Claude Dashboards is in beta on paid Claude plans and connects to Snowflake, BigQuery, Databricks, Redshift, ClickHouse, and Salesforce. People viewing a shared dashboard need their own access to the underlying data. Prefer something you own outright? We build custom AI dashboards too.
Get started
Want to see this on your own data?
Tell us where your data lives and what you'd ask it. We'll tell you honestly how close you are to a dashboard like this.
- A free call with a senior consultant, not a sales rep
- An honest read on what to tackle first, and what can wait
- No pitch deck, no pressure, no obligation
Or send us a note
A few lines is plenty. We'll take it from there.